
What are support and resistance zones
Support and resistance represent key junctures where the forces of supply and demand meet. These lines appear as thresholds to price patterns. They are the respective lines which stops the prices from decreasing or increasing.
A support line refers to that level beyond which a stock’s price will not fall. It denotes that price level at which there is a sufficient amount of demand to stop and possibly, for a time, turn a downtrend higher. Similarly a resistance line refers to that line beyond which a stock’s price will not increase. It indicates that price level at which a sufficient supply of stock is available to stop and possibly, for a time, head off an uptrend in prices. Trend lines are often referred to as support and resistance lines on an angle
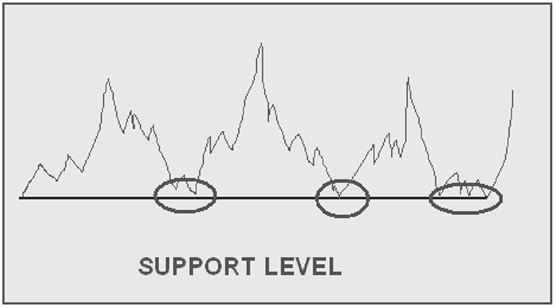
Support
A support is a horizontal floor where interest in buying a commodity is strong enough to overcome the pressure to sell. Support level is the price level at which sufficient demand exists to, at least temporarily, halt a downward movement in prices. Logically as the price declines towards support and gets cheaper, buyers become more inclined to buy and sellers become less inclined to sell. By the time the price reaches the support level, it is believed that demand will overcome supply and prevent the price from falling below support.
Support does not always hold true and a break below support signals that the bulls have lost over the bears. A fall below support level indicates more willingness to sell and a lack of willingness to buy. A break in the levels of support indicates that the expectations of sellers are reducing and they are ready to sell at even lower prices. In addition, buyers could not be coerced into buying until prices declined below support or below the previous low. Once support is broken, another support level will have to be established at a lower level
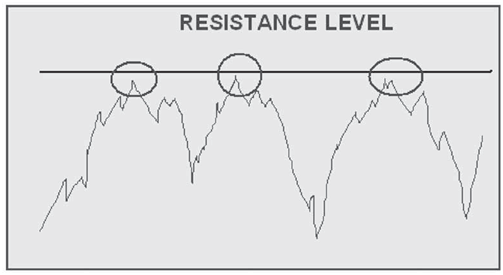
Resistance
A resistance is a horizontal ceiling where the pressure to sell is greater than the pressure to buy. Thus a Resistance level is a price at which sufficient supply exists to; at least temporarily, halt an upward movement. Logically as the price advances towards resistance, sellers become more inclined to sell and buyers become less inclined to buy. By the time the price reaches the resistance level, it is believed that supply will overcome demand and prevent the price from rising above resistance.
Resistance does not always hold true and a break above resistance signals that the bears have lost over the bulls. A break in the resistance level shows more willingness to buy or lack of incentive to sell. Resistance breaks and new highs indicate that buyer’s expectations have increased and are ready to buy at even higher prices. In addition, sellers could not be coerced into selling until prices rose above resistance or above the previous high. Once resistance is broken, another resistance level will have to be established at a higher level.
Why do support and resistance lines occur?
A stock’s price is determined by supply and demand. Bulls buy when the stock’s is prices are too low and bears sell when the price reaches its maximum. Bulls increase the prices by increasing the demand and bears decrease it by increasing the supply. The market reaches a balance when bulls and bears agree on a price.
When prices are increasing upward, there exists a point at which the bears become more aggressive the bulls begin to pull back – the market balances along the resistance line.
When prices are going downwards, the market balances along the support line. As prices starts to decline toward the support line, buyers become more inclined to buy and sellers start holding on to their stocks. The support line marks the point where demand takes precedence over supply and prices will not decrease below that support line. The reverse holds true for a resistance line.
Prices often break through support and resistance lines. A break through a resistance line shows that the buyers have won out over the sellers. The price of the stock is bid higher than the previous levels by the Bulls. Once the resistance line is broken, another will be created at a higher level. The reverse holds true for a support line.
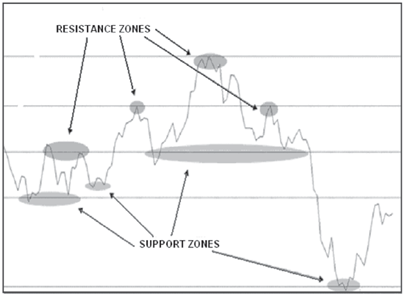
Support and resistance zones
Support and resistance is often thought of as a price level. For example, analysts and traders might discuss support for Nifty futures contract is at 4850. As a trader, if you are looking for
a place to go long would you wait for the market to actually trade at 4850 before taking a position? Should you buy one, two or maybe five ticks above the low and stop yourself out one tick through the low to manage your risk in the long position. If you wait for a test of support, you could miss a trading opportunity. The problem is thinking about support and resistance as a precise price level and this is where most traders err. It is very common for most people to think of support and resistance levels in terms of absolute price levels. For instance, if they are looking at Rs 50 as a resistance levels, they mean exactly Rs 50.
In reality, support and resistance levels are not exact prices, but rather price zones. So, if the resistance level is Rs50, then it is actually the zone around that 50 level that is the resistance. The stock may hit only 49.87 or it may hit 50.25 and still hold the Rs 50 as price resistance. One solution is to use price zones for support and resistance instead of price levels. Support and resistance zones give you a better trading opportunity. A risk taking investor may buy at top of support zone whereas a cautious investor may want to wait till the bottom of support zone.
The main factor in determining exactly how much the exact prices are tested by is how quickly or slowly the prices move into that resistance zone. For instance, if the zone hits very quickly on a large momentum surge, then it is more likely to hit that 50.25 level. This is also the case if the stock is a rather volatile one with a wide price range intraday. If the security spikes higher and does not quite hit the price resistance, such as a spike into 49.70, then it may round off into 50 with slightly higher highs and never exactly touch the Rs 50 price resistance zone before turning over due to the slowdown in momentum into that resistance. The larger the time frame, the greater the price zone is as well. A resistance zone at 50 on a weekly time frame may have a range of 1 Rs on each side of 50. Where traders tend to run into trouble
is in thinking that because the stock has traded over 50 therefore the Rs 50 resistance has been broken, so we often hear of people “buying the highs” or “shorting the lows” in the case of support.
Resistance levels can transform into support levels and vice versa. After prices break through a support level, investors may try to limit their losses by selling the stock, pushing prices back up to the line which now becomes a resistance level.
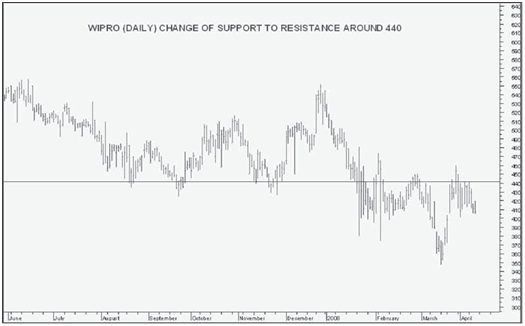
Change of support to resistance and vice versa
Another principle of technical analysis stipulates that support can turn into resistance and visa versa. Once the price penetrates below the support level, the earlier or the broken support level can turn into resistance. The break of support level signals that the forces of supply have overcome the forces of demand. Therefore, if the price returns to this level, there is likely to be an increase in supply, and hence resistance.
Another aspect of technical analysis is resistance turning into support. As the price increases above resistance, it signals changes in demand and supply. The breakout above resistance proves that the forces of demand have overcome the forces of supply. If the price returns to this level, there is likely to be an increase in demand and support can be established at this point
Why are support and resistance lines important?
Technical analysts often say that the market has a memory. Support and resistance lines are a key component of that memory.Investors “tend” to remember previous area levels and thus make them important. When a price of a stock is changing rapidly each day the buying and selling will be done at a divergent level and there will not exist any unanimity or pattern in price changing. But when prices trade within a narrow range for a period of time an area is formed and investors begin to remember that specific price.If the prices stay in an area for a longer period than the volume of that spot increases and that level becomes more important because investors remember it exceptionally well. Therefore, that level becomes more significant for the technical analyst. According to experts, previous support and resistance levels can be used as “target” or “limit” prices when the market have traded away from them. Assume that a year ago a rally ended with a top price of 120. That price of 120 then becomes a resistance level for the rally occurring in today’s market.