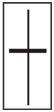
Doji candlestick pattern
Doji lines are patterns with the same open and close price. It’s a significant reversal indicator.
The Importance of the Doji
The perfect doji session has the same opening and closing price, yet there is some flexibility to this rule. If the opening and closing price are within a few ticks of each other, the line could still be viewed as a doji.
How do you decide whether a near-doji day (that is, where the open and close are very close, but not exact) should be considered a doji? This is subjective and there are no rigid rules but one way is to look at a near-doji day in relation to recent action. If there are a series of very small real bodies, the near-doji day would not be viewed as significant since so many other recent periods had small real bodies. One technique is based on recent market activity. If the market is at an important market junction, or is at the mature part of a bull or bear move, or there are other technical signals sending out an alert, the appearance of a near-doji is treated as a doji. The philosophy is that a doji can be a significant warning and that it is better to attend to a false warning than to ignore a real one. To ignore a doji, with all its inherent implications, could be dangerous.
The doji is a distinct trend change signal. However, the likelihood of a reversal increases if subsequent candlesticks confirm the doji’s reversal potential. Doji sessions are important only in markets where there are not many doji. If there are many doji on a particular chart, one should not view the emergence of a new doji in that particular market as a meaningful development. That is why candlestick analysis usually should not use intra-day charts of less than 30 minutes. Less than 30 minutes and many of the candlestick lines become doji or near doji
Doji at tops
A Doji star at the top is a warning that the uptrend is about to change. This is especially true after a long white candlestick in an uptrend. The reason for the doji’s negative implications in uptrend is because a doji represents indecision. Indecision among bulls will not maintain the uptrend. It takes the conviction of buyers to sustain a rally. If the market has had an extended rally, or is overbought, then formation of a doji could mean the scaffolding of buyers’ support will give way.
Doji are also valued for their ability to show reversal potential in downtrends. The reason may be that a doji reflects a balance between buying and selling forces. With ambivalent market
participants, the market could fall due to its own weight. Thus, an uptrend should reverse but a falling market may continue its descent. Because of this, doji need more confirmation to signal a bottom than they do a top.