Elliott Wave

.Introduction

Elliott Wave theory is developed by Ralph Nelson Elliott (1871-1948) and is successfully being used by market participants to analyze stock market to forecast market trends.
Elliot Wave theory is based on the hypothesis that stock prices move between optimism and pessimism of all market participants’ psychology and wide swings in the participants’ psychology makes stock prices move in a certain patterns/trends.
Fundamental Concept

Elliott Wave theory suggests that stock prices move in clear trends. These trends can be classified in two parts i.e.
A. Dominant trend (Five wave pattern)
B. Corrective trend (Three wave pattern)

A. Dominant Trend (Five wave pattern)

Basically Dominant Trend consists of five waves. These five waves can be in either direction, up or down.

When five waves directions is up then advancing waves are known as impulsive waves and declining waves are known as corrective waves.

Similarly when five waves directions is down then declining waves are known as impulsive waves and advancing waves are known as corrective waves.

This would be more clearer from (Figure 6) & (Figure7)

Characteristic of Dominant Trend (when markets are rising)

Each individual Wave of the dominant trend has its own characteristic. One should understand

these characteristics which is the key to practical application of Elliott Theory. These are described as-
 Wave 1: Wave 1 is usually a weak rally with only small number of traders participating in the market. This is because fundamental news is still negative and above all previous trend which was declining is still considered strong to be in force.
 Wave 2: Wave 2 is a sell off once wave 1 is over and these sell off is very vicious (sharp). But wave 2 never extends beyond the starting point of wave 1. Wave 2 finally ends without making new lows and prices turn for another rally.

Wave 3: The initial stage of the wave 3 is a slow rally as market participants are not convinced about the rally. Practically lot of sell side positions are there in the market and these get squared off as and when markets rally and finally sell side positions are closed when top of wave 1 is crossed. This is the time when top of wave 1 is crossed market participants are convinced about the rally and there is sudden buy side interest in the market. Wave 3 is usually the largest and most powerful wave of dominant trend

  • Wave 4: Finally wave 3 ends as traders who were long from the lower levels takes profits, hence profit taking starts. Basically wave 4 is a clear correction on lesser volume than wave 3.While profit taking is on, majority of the market participants are convinced that trend is up. There are two schools of thoughts here to trade Wave One is to buy on decline if one understands the potential ahead for wave 5. The other is to wait for wave 4 to end and buy when market rallies again.
  • Wave 5: Wave 5 is the last wave of dominant trend. Although prices make new high above wave 3 but volumes is usually lesser than volume in wave The wave 5 lacks the strength witnessed in wave 3 rallies and finally markets tops out and enter new phase.

Characteristic of Dominant Trend (when markets are declining)

  • Wave 1: Wave 1 is usually a small correction with only small number of traders participating

    in the market. This is because fundamental news is still positive and above all previous trend which was rising is still considered to be strong in force.

    • Wave 2: Wave 2 is a strong rally once wave 1 is But wave 2 never extends beyond the starting point of wave 1. Wave 2 finally ends without making new highs and prices starts declining again.
  • Wave 3: The initial stage of the wave 3 is a slow decline as market participants are not convinced about the decline. Practically lot of buy side positions are there in the market and these get squared off as and when markets declines and finally buy side positions are closed when bottom of wave 1 is crossed. This is the time when bottom of wave 1 is crossed, market participants are convinced about the decline and there is sudden sell side interest in the market. Wave 3 is usually the largest and most powerful wave of dominant
  • Wave 4: Finally wave 3 ends as traders who were short from the higher levels takes profit, hence profit taking starts. Basically wave 4 is a clear pull back on lesser volume than wave 3.While profit taking is on, majority of the market participants are convinced that trend is There are two schools of thoughts here to trade Wave 4. One is to sell on rally if one understands the potential ahead for wave 5.The other is to wait for wave 4 to end and sell when market declines again.
  • Wave 5: Wave 5 is the last wave of dominant trend. Although prices make new low below the wave 3 but volumes is usually lesser than volume in wave The wave 5 lacks weakness found in wave 3 declines and finally markets bottoms out and enter new phase.
  1. Corrective trend (Three wave pattern)

Corrective Trend consists of three waves. Basically three wave corrective trend starts when five wave dominant trend ends.After market rallies in a basic 5 wave sequence, market top is made and markets enter a new phase i.e. three wave downward corrective phase i.e. A, B and C which would be clearer from

illustrates ABC corrective sequence after market rallied in a basic five wave sequence. Here entire move is clearly down after Wave 5 is formed. Hence Wave A and C are impulse waves and wave B is a corrective wave.

Similarly After market declines in a basic 5 wave sequence, market bottom is made and markets enter a new phase i.e. three wave upward corrective phase i.e. A, B and C which

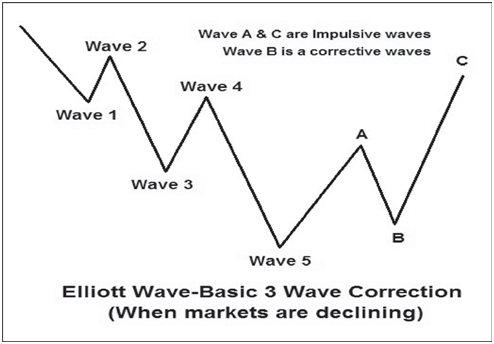
illustrates ABC corrective sequence after market declined in a basic five wave sequence. Here entire move is clearly up after Wave 5 is formed. Hence Wave A and C are impulse waves and wave B is a corrective wave.

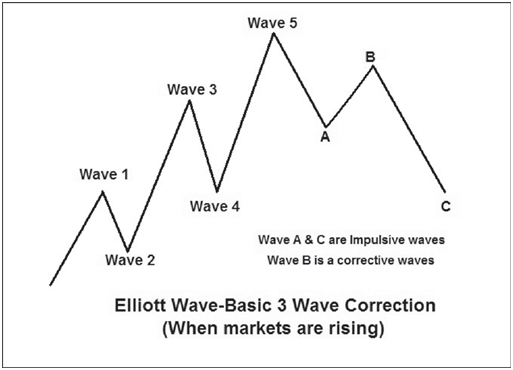
Characteristic of Corrective Waves after market rallies in a basic five wave sequence

Each individual Wave of the corrective trend has its own characteristic. One should understand these characteristics which is the key to practical application of Elliott Theory. These are described as-

  • Wave A: Wave A is the beginning of a new bear market, fundamental news is still positive and nobody is ready to accept the fact that markets can
  • Wave B: Wave B is basically a small rally which gives the feeling that Bull Run has again started but prices fail to make new high and typical volume characteristic here is that Volume in Wave B is lesser than Wave
  • Wave C: Here prices again starts declining and volume also pick up and it’s in Wave C that everyone realizes that market decline is likely to continue and hence market participation on the sell side

Characteristic of Corrective Waves after market declines in a basic five wave sequence

 Wave A: Wave A is the beginning of a new bull market, fundamental news is still negative and nobody is ready to accept the fact that markets could rally.

  • Wave B: Wave B is basically a small decline which gives the feeling that decline has again started but prices fail to make new low and typical volume characteristic here is that Volume in Wave B is lesser than Wave
  • Wave C: Here prices again starts rising and volume also pick up and it’s in Wave C that everyone realizes that market rally is likely to continue and hence market participation on the buy side

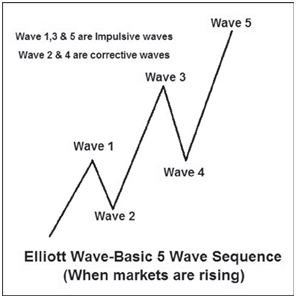
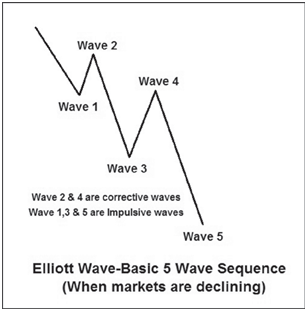
Combining five wave dominant sequences with a three wave corrective sequence completes basic fundamental concept behind Elliott Theory.

  1. Pattern Recognition and Fractals

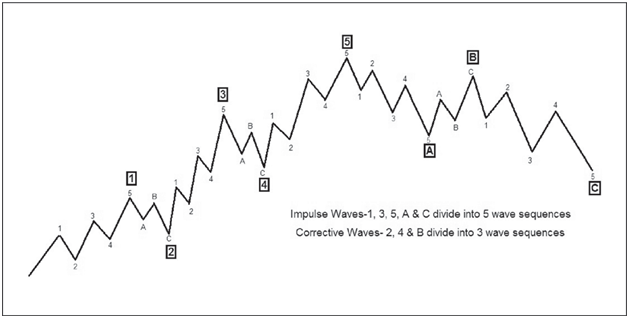
Elliott Wave theory suggests that stock prices move in clear trends which can be defined as five wave dominant trends followed by three wave corrective trend. Basically one looks at price chart to define these trends i.e. dominant trend or corrective trend. Hence it can be said that these waves move in certain patterns and application of Elliott Wave theory is a form of pattern recognition.

Elliott Wave theory suggests that irrespective of size of the wave, all impulse waves are subdivided into five smaller waves and all corrective waves are subdivided into three smaller waves. Hence Elliot Wave is a fractal (Fractal is typically a self similar patterns appearing at every degree of trend where self similar means they are “the same from near as from far”). This would be more clearer for (Figure 18) and (Figure 19) which shows fractal nature of Elliott Wave.