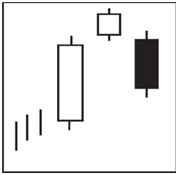
The Evening Star is a top reversal pattern that occurs at the top of an uptrend. It is formed by a tall white body candle, a second candle with a small real body that gaps above the first real body to form a “star” and a third black candle that closes well into the first session’s white real body.
Description
The Evening Star pattern is a bearish reversal signal. Like the planet Venus, the evening star represents that darkness is about to set or prices are going to decline. An uptrend has been in place which is assisted by a long
range remain small for the day. Again, this is the star of the formation. The third day is a black candle day and represents the fact that the bears have now seized control. That candle should consist of a closing that is at least halfway down the white candle of two days prior. The optimal Evening Star signal would have a gap before and after the star day.
Criteria
- The uptrend should be
- The body of the first candle is white, continuing the current The second candle has small trading range showing indecision formation.
- The third day shows evidence that the bears have stepped in. That candle should close at least halfway down the white
Signal enhancements
- Long length of the white candle and the black candle indicates more forceful
- The more indecision the middle day portrays, the better probabilities that a reversal will
- A gap between the first day and the second day adds to the probability of occurrence of reversal.
- A gap before and after the star day is even more desirable. The magnitude, that the third day comes down into the white candle of the first day, indicates the strength of the reversal.
Pattern psychology
The psychology behind this pattern is that a strong uptrend has been in effect. Buyers have been piling up the stock. However, it is the level where sellers start taking profits or think the price is fairly valued. The next day all the buying is being met with the selling, causing for a small trading range. The bulls get concerned and the bears start taking over. The third day is a large sell off day. If there is big volume during these days, it shows that the ownership has dramatically changed hands. The change of direction is immediately seen in the color of the bodies.white candlestick. The following day gaps up, yet the trading