
Head and Shoulders
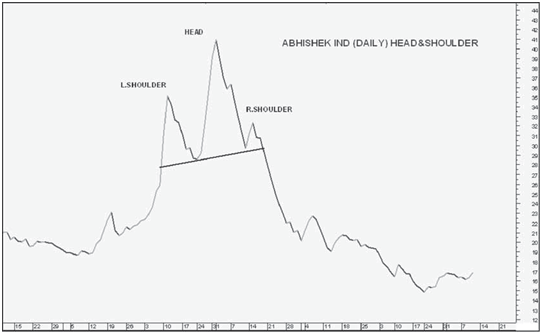
The head and shoulders pattern can be either head and shoulders, top or head and shoulders bottom. The Charts are a picture of a head and shoulders movement, which portrays three successive rallies and reactions with the second one making the highest/lowest point.
Head and Shoulders (Top reversal)
A Head and Shoulders (Top) is a reversal pattern which occurs following an extended uptrend forms and its completion marks a trend reversal. The pattern contains three successive peaks with the middle peak (head) being the highest and the two outside peaks (shoulders) being low and roughly equal. The reaction lows of each peak can be connected to form support, or a neckline
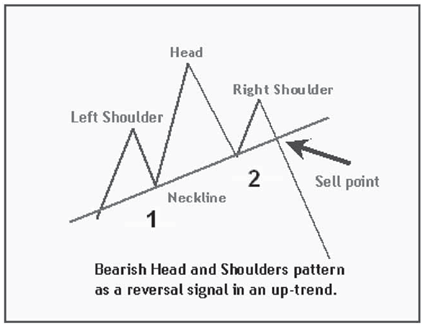
As its name implies, the head and shoulders reversal pattern is made up of a left shoulder, head, right shoulder, and neckline. Other parts playing a role in the pattern are volume, the
breakout, price target and support turned resistance. Lets look at each part individually, and then put them together with some example
- Prior trend: It is important to establish the existence of a prior uptrend for this to be a reversal pattern. Without a prior uptrend to reverse, there cannot be a head and shoulders reversal pattern, or any reversal pattern for that
- Left shoulder: While in an uptrend, the left shoulder forms a peak that marks the high point of the current trend. It is formed usually at the end of an extensive advance during which volume is quite At the end of the left shoulder there is usually a dip or recession which typically occurs on low volume.
- Head: From the low of the left shoulder, an advance begins that exceeds the previous high and marks the top of the head. At this point, in order conform to proper form, prices must come down somewhere near the low of the left shoulder –somewhat lower perhaps or somewhat higher but in any case, below the top of the left
- Right shoulder: The right shoulder is formed when the low of the head advances The peak of the right shoulder is almost equal in height to that of the left shoulder but lower than the head. While symmetry is preferred, sometimes the shoulders can be out of whack. The decline from the peak of the right shoulder should break the neckline.
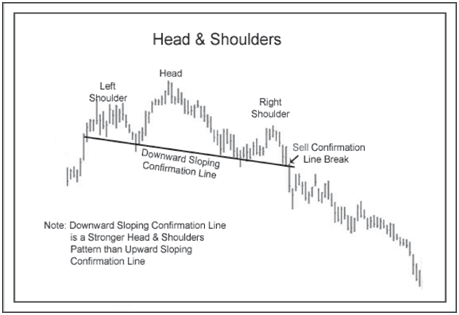
- Neckline: A neckline can be drawn across the bottoms of the left shoulder, the head and the right A breaking of this neckline on a decline from the right shoulder is the final confirmation and completes the head and shoulder formation.
- Volume: As the head and shoulders pattern unfolds, volume plays an important role in confirmation. Volume can be measured as an indicator (OBV, Chaikin Money Flow) or simply by analyzing volume levels. Ideally, but not always, volume during the advance of the left shoulder should be higher than during the advance of the head. These decreases in volume along with new highs that form the head serve as a warning sign. The next warning sign comes when volume increases on the decline from the peak of the head. Final confirmation comes when volume further increases during the decline of the right
- Neckline break: The head and shoulders pattern is said to be complete only when the neckline support is broken. Ideally, this should also occur in a convincing manner with an expansion in
- Support turned resistance: Once support is broken, it is common for this same support level to turn into Sometimes, but certainly not always, the price will return to the support break, and offer a second chance to sell.
- Price target: After breaking neckline support, the projected price decline is found by measuring the distance from the neckline to the top of the Price target is calculated by subtracting the above distance from the neckline. Any price target should serve as a rough guide, and other factors such as previous support levels should be considered as well
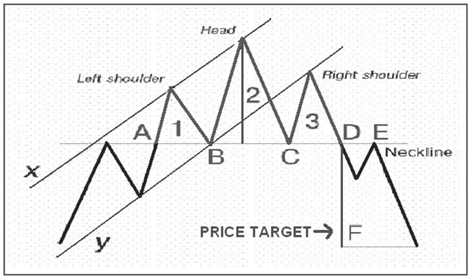
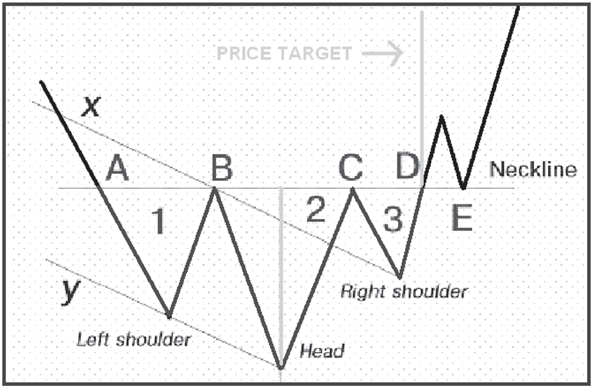
- The support line is based on points B andThe resistance line. After giving in at point D, the market may retest the neckline at point E.
- The price If the neckline holds the buying pressure at point E, then the formation provides information regarding the price direction: diametrically opposed to the direction of the head-and-shoulders (bearish).
The price target D to F. This is provided by the confirmation of the formation (by breaking through the neckline under heavy trading volume). This is equal to the range from top of the head to neckline.
Some important points to remember
- The head and shoulders pattern is one of the most common reversal formations. It occurs after an uptrend and usually marks a major trend reversal when
- It is preferable that the left and right shoulders be symmetrical, it is not an absolute requirement. They can be different widths as well as different
- Volume support and neckline support identification are considered to be the most critical factors. The support break indicates a new willingness to sell at lower There is an increase in supply combined with lower prices and increasing volume .The combination can be lethal, and sometimes, there is no second chance return to the support break.
- Measuring the expected length of the decline after the breakout can be helpful, but it is not always necessary target. As the pattern unfolds over time, other aspects of the technical picture are likely to take
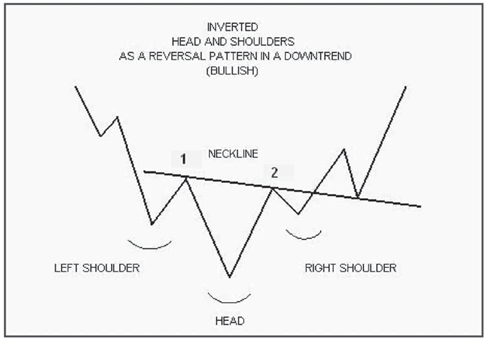
head and shoulders bottom
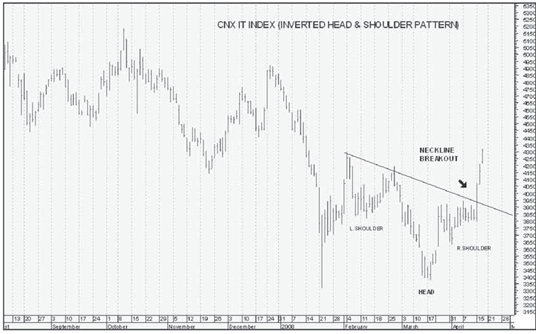
The head and shoulders bottom is the inverse of the H&S Top. In the chart below, after a period, the downward trend reaches a climax, which is followed by a rally that tends to carry the share back approximately to the neckline. After a decline below the previous low followed by a rally, the head is formed. This is followed by the third decline which fails to reach the previous low. The advance from this point continues across the neckline and constitutes the breakthrough.
The main difference between this and the Head and Shoulders Top is in the volume pattern associated with the share price movements.
The volume should increase with the increase in the price from the bottom of the head and then it should start increasing even more on the rally which is followed by the right shoulder. If the neckline is broken but volume is low, you should be skeptical about the validity of the formation.
As a major reversal pattern, the head and shoulders bottom forms after a downtrend, and its completion marks a change in trend. The pattern contains three troughs in successive manner with the two outside troughs namely the right and the shoulder being lower in height than the middle trough (head) which is the deepest. Ideally, the two shoulders i.e. the right and the left shoulder should be equal in height and width. The reaction highs in the middle of the pattern can be connected to form resistance, or a neckline.
Head and shoulders bottom
The price action remains roughly the same for both the head and shoulders top and bottom, but in a reversed manner. The biggest difference between the two is played by the volume. While an increase in volume on the neckline breakout for a head and shoulders top is welcomed, it is absolutely required for a bottom. Lets look at each part of the pattern individually, keeping volume in mind:
- Prior trend: For this to be a reversal pattern it is important to establish the existence of a prior downtrend for this to be a reversal pattern. There cannot be a head and shoulders bottom formation, without a prior downtrend to
- Left shoulder: It is formed after an extensive increase in price, usually supported by high volume. While in a downtrend, the left shoulder forms a trough that marks a new reaction low in the current After forming this trough, an advance ensues to complete the formation of the left shoulder. The high of the decline usually remains below any longer trend line, thus keeping the downtrend intact.
- Head: After the formation of the left shoulder, a decline begins that exceeds the previous low and forms a point at an even lower After making a bottom, the high of the subsequent advance forms the second point of the neckline.
- Right shoulder: Right shoulder is formed when the high of the head begins to decline. The height of the right shoulder is always less than the head and is usually in line with the left shoulder, though it can be narrower or When the advance from the low of the right shoulder breaks the neckline, the head and shoulders reversal is complete.
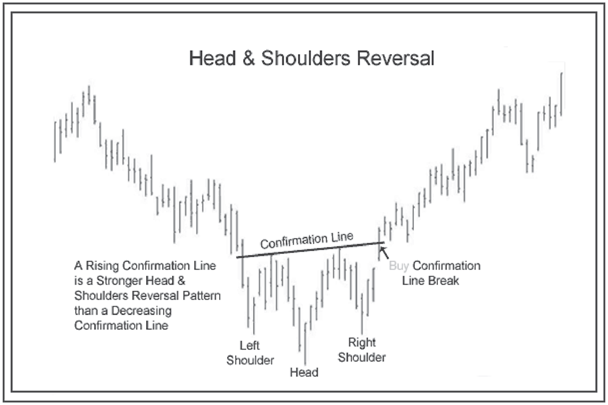
- Neckline: The neckline is drawn through the highest points of the two intervening troughs and may slope upward or downward. The neckline forms by connecting two reaction highs. The first reaction marks the end of the left shoulder and the beginning of the The second reaction marks the end of the head and the beginning of the right shoulder. Depending on the relationship between the two reaction highs, the neckline can slope up, slope down, or be horizontal. The slope of the neckline will affect the pattern’s degree of bullishness: an upward slope is more bullish than downward slope.
- Volume: Volume plays a very important role in head and shoulders
Without the proper expansion of volume, the validity of any breakout becomes suspect. Volume can be measured as an indicator (OBV, Chaikin Money Flow) or simply by analyzing the absolute levels associated with each peak and trough.
Volume levels during the second half of the pattern are more important than the first half. The decline of the volume of the left shoulder is usually heavy and selling pressure is also very intense. The selling continues to be intense even during the decline that forms the low of the head. After this low, subsequent volume patterns should be watched carefully to look for expansion during the advances.
The advance from the low of the head should be accompanied by an increase in volume and/or better indicator readings (e.g. CMF > 0 or strength in OBV). After the formation the
second neckline point by the reaction high, there should be a decline in the right shoulder accompanied with light volume. It is normal to experience profit-taking after an advance. Volume analysis helps distinguish between normal profit-taking and heavy selling pressure. With light volume on the pullback, indicators like CMF and OBV should remain strong. The most important moment for volume occurs on the advance from the low of the right shoulder. For a breakout to be considered valid there needs to be an expansion of volume on the advance and during the breakout.
Some important points to remember:
- Head and shoulder bottom is one of the most common and reliable reversal formations. They occur after a downtrend and usually mark a major trend reversal when
- It is preferable but not a necessary requirement that the left and right shoulders be symmetrical. Shoulders can be of different widths as well as different If you are looking for the perfect pattern, then it will take a long time to come.
- The major focus of the analysis of the head and shoulders bottom should be the correct identification of neckline resistance and volume patterns. These are two of the most important aspects to a successful The neckline resistance breakout combined with an increase in volume indicates an increase in demand at higher prices. Buyers are exerting greater force and the price is being affected.
- As seen from the examples, traders do not always have to choose a stock after the neckline Many times, the price will return to this new support level and offer a second chance to buy. Measuring the expected length of the advance after the breakout can be helpful, but it is not always necessary to achieve the final target. As the pattern unfolds over time, other aspects of the technical picture are likely to take precedent.