Money Flow Index
Money flow index takes into account volume action and on the basis of volume action; it attempts to measure the strength of money flowing in and out the security which now a days is also known as smart money flow indicator.
To understand calculation aspect of MFI, one should first understand positive money flow and negative money flow which is the basis of MFI. When day’s average price is greater than previous day’s average price, it’s said to be positive money flow and similarly when day’s average price is less than previous day’s average price; it’s said to be negative money flow. Money flow for a specific day is calculated by multiplying the average price by the volume. Positive money flow is calculated by summing the positive money flow over a specified number of periods. Negative money flow is calculated by summing the negative money flow over a specified number of periods.
When one divides positive money flow by negative money flow, one gets money ratio. Finally MFI = 100-100/(1+money ratio)
Interpretation of MFI
Most popularly MFI indicator is used in two ways
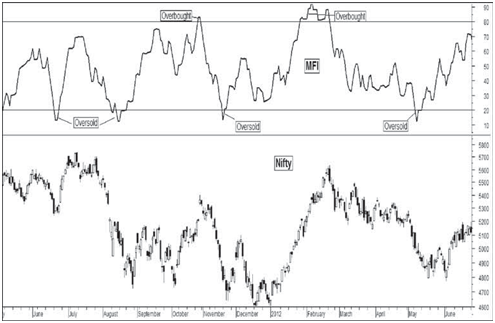
a. To define overbought and oversold zone- Generally MFI reading above 80 is considered overbought and MFI reading below 20 is considered oversold. It basically suggests that
• One should book profit in buy side positions and should avoid new buy side positions in an overbought zone.
• One should book profit in sell side positions and should avoid new sell side positions in an oversold zone
This would be clearer from figure below.