
Moving Average Convergence/Divergence (MACD)
MACD stands for Moving Average Convergence / Divergence. It is a technical analysis indicator created by Gerald Appel in the late 1970s. The MACD indicator is basically a refinement of the two moving averages system and measures the distance between the two moving average lines.
What is the MACD and how is it calculated?
The MACD does not completely fall into either the trend-leading indicator or trend following indicator; it is in fact a hybrid with elements of both. The MACD comprises two lines, the fast line and the slow or signal line. These are easy to identify as the slow line will be the smoother of the two.
NIFTY chart below illustrates the basic MACD lines
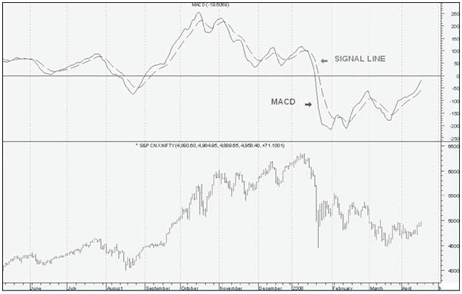
Step1. Calculate a 12 period exponential moving average of the close price.Step2. Calculate a 26 period exponential moving average of the close price.Step3. Subtract the 26 period moving average from the 12 period moving average. This is the fast MACD line.
Step4. Calculate a 9 period exponential moving average of the fast MACD line calculated above. This is the slow or signal MACD line
MACD benefits
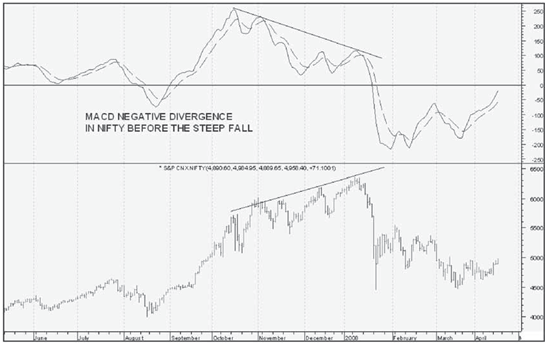
The importance of MACD lies in the fact that it takes into account the aspects of both momentum and trend in one indicator. As a trend-following indicator, it will not be wrong for very long. The use of moving averages ensures that the indicator will eventually follow the movements of the underlying security. By using exponential moving averages, as opposed to simple moving averages, some of the lag has been taken out. As a momentum indicator, MACD has the ability to foreshadow moves in the underlying security. MACD divergences can be key factors in predicting a trend change. A negative divergence signals that bullish momentum is going to end and there could be a potential change in trend from bullish to bearish. This can serve as an alert for traders to take some profits in long positions, or for aggressive traders to consider initiating a short position.
MACD can be applied to daily, weekly or monthly charts. The MACD indicator is basically a refinement of the two moving averages system and measures the distance between the two moving average. The standard setting for MACD is the difference between the 12 and 26- period EMA. However, any combination of moving averages can be used.
averages used in MACD can be tailored for each individual security. For weekly charts, a faster set of moving averages may be appropriate. For volatile stocks, slower moving averages may be needed to help smooth the data. No matter what the characteristics of the underlying security, each individual can set MACD to suit his or her own trading style, objectives and risk tolerance.The set of moving averages used in MACD can be tailored for each individual security. For weekly charts, a faster set of moving averages may be appropriate. For volatile stocks, slower moving averages may be needed to help smooth the data. No matter what the characteristics of the underlying security, each individual can set MACD to suit his or her own trading style, objectives and risk tolerance.
Use of MACD lines
MACD generates signals from three main sources:
• Moving average crossover
• Centerline crossover
• Divergence
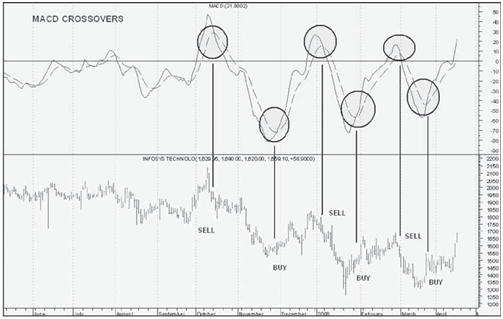
Crossover of fast and slow lines
The MACD proves most effective in wide-swinging trading markets. We will first consider the use of the two MACD lines. The signals to go long or short are provided by a crossing of the fast and slow lines. The basic MACD trading rules are as follows:
• Go long when the fast line crosses above the slow line.
• Go short when the fast line crosses below the slow line.
These signals are best when they occur some distance above or below the reference line. If the lines remain near the reference line for an extended period as usually occurs in a sideways market, then the signals should be ignored.
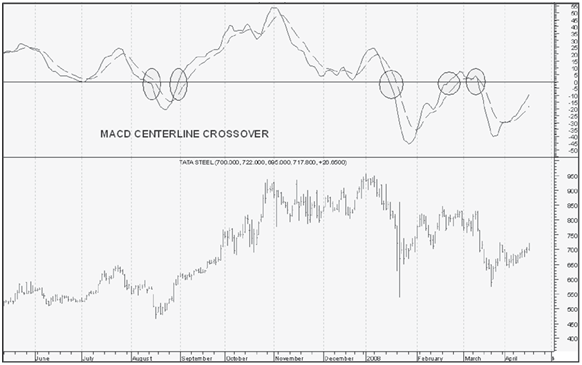
Center line crossover
A bullish centerline crossover occurs when MACD moves above the zero line and into positive territory. This is a clear indication that momentum has changed from negative to positive or from bearish to bullish. After a positive divergence and bullish moving average crossover, the centerline crossover can act as a confirmation signal. Of the three signals, moving average crossover are probably the second most common signals.
A bearish centerline crossover occurs when MACD moves below zero and into negative territory. This is a clear indication that momentum has changed from positive to negative or from bullish to bearish. The centerline crossover can act as an independent signal, or confirm a prior signal such as a moving average crossover or negative divergence. Once MACD crosses into negative territory, momentum, at least for the short term, has turned bearish.
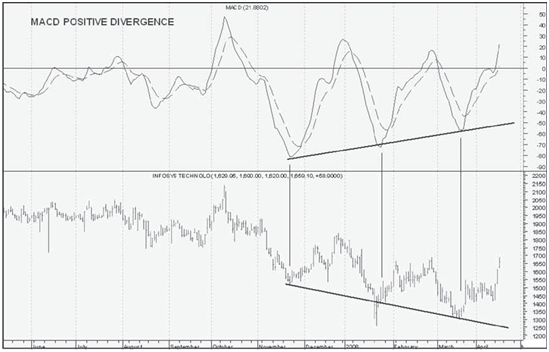
Divergence
An indication that an end to the current trend may be near occurs when the MACD diverges from the security. A positive divergence occurs when MACD begins to advance and the security is still in a downtrend and makes a lower reaction low. MACD can either form as a series of higher lows or a second low that is higher than the previous low. Positive divergences are probably the least common of the three signals, but are usually the most reliable and lead to the biggest moves.
A negative divergence forms when the security advances or moves sideways and MACD declines. The negative divergence in MACD can take the form of either a lower high or a straight decline. Negative divergences are probably the least common of the three signals, but are usually the most reliable and can warn of an impending peak.
To Summarize
- The MACD is a hybrid trend following and trend leading
- The MACD consists of two lines; a fast line and a slow ‘signal’
- A long position is indicated by a cross of the fast line from below to above the slow
- A short position is indicated by a cross of the fast line from above to below the slow line.
- MACD should be avoided in trading markets
- The MACD is useful for determining the presence of divergences with the price