
Moving averages
One of the most common and familiar trend-following indicators is the moving averages. They smooth a data series and make it easier to spot trends, something that is especially helpful in volatile markets. They also form the building blocks for many other technical indicators and overlays.
The two most popular types of moving averages are the Simple Moving Average (SMA) and the Exponential Moving Average (EMA). They are described in more detail below.
Simple moving average (SMA)
A simple moving average is formed by computing the average (mean) price of a security over a specified number of periods. It places equal value on every price for the time span selected. While it is possible to create moving averages from the Open, the High, and the Low data points, most moving averages are created using the closing price. For example: a 5-day simple moving average is calculated by adding the closing prices for the last 5 days and dividing the total by 5.

The calculation is repeated for each price bar on the chart. The averages are then joined to form a smooth curving line – the moving average line. Continuing our example, if the next closing price in the average is 15, then this new period would be added and the oldest day, which is 10, would be dropped.
The new 5-day simple moving average would be calculated as follows:
Over the last 2 days, the SMA moved from 12 to 13. As new days are added, the old days will be subtracted and the moving average will continue to move over time.
Exponential moving average (EMA)
Exponential moving average also called as exponentially weighted moving average is calculated by applying more weight to recent prices relative to older prices. In order to reduce the lag in simple moving averages, technicians often use exponential moving averages. The weighting applied to the most recent price depends on the specified period of the moving average. The
shorter the EMA’s period, weight is applied to the most recent price. For example: a 10-period exponential moving average weighs the most recent price 18.18% while a 20-period EMA weighs the most recent price 9.52%. As we’ll see, the calculating and EMA is much harder than calculating an SMA. The important thing to remember is that the exponential moving average puts more weight on recent prices. As such, it will react quicker to recent price changes than a simple moving average. Here’s the calculation formula.
Exponential moving average calculation
Exponential Moving Averages can be specified in two ways – as a percent-based EMA or as a period-based EMA. A percent-based EMA has a percentage as its single parameter while a period-based EMA has a parameter that represents the duration of the EMA. The formula for an exponential moving average is:
EMA (current) = ((Price (current) – EMA (prev)) x (Multiplier) + EMA (prev)
For a percentage-based EMA, “Multiplier” is equal to the EMA’s specified percentage. For a period-based EMA, “Multiplier” is equal to 2 / (1 + N) where N is the specified number of periods.
For example, a 10-period EMA’s Multiplier is calculated like this:
This means that a 10-period EMA is equivalent to an 18.18% EMA.
The 10-period simple moving average is used for the first calculation only. After that the previous period’s EMA is used.
Note that, in exponential moving average, every previous closing price in the data set is used in the calculation. The impact of the older data never disappears though it diminishes over a period of time. This is true regardless of the EMA’s specified period. The effects of older data diminish rapidly for shorter EMA’s than for longer ones but, again, they never completely disappear.
Simple versus exponential
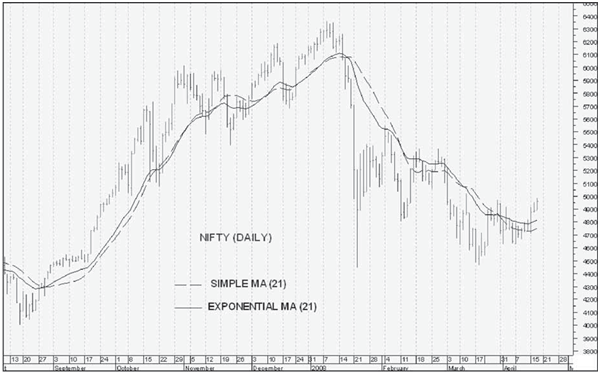
Generally you will find very little difference between an exponential moving average and a simple moving average. Consider this example which uses only 21 trading days, the difference is minimal but a difference nonetheless. The exponential moving average is consistently closer to the actual price. On average, the EMA is 3/8 of a point closer to the actual price than the SMA.
Which is better?
A question about moving averages that seems to weigh heavily on traders’ minds is whether to use the “simple” or “exponential” moving average. Regardless of the type you choose, the basic principle is that if there is more buying pressure than selling pressure, prices will move above the average and the market will be in an uptrend. On the other hand heavy selling pressure will make the prices drop below the moving average, indicating a downtrend.
The choice of moving average depends on various factors like your trading frequency, investing style and the stock which has been traded by you. The simple moving average obviously has a lag, but the exponential moving average may be prone to quicker breaks. Some traders prefer to use exponential moving averages for shorter time periods to capture changes quicker. Some investors prefer simple moving averages over long time periods to identify long-term trend changes. In addition, much will depend on the individual security in question. A 50- day SMA might work great for identifying support levels in INFOSYS but a 100-day EMA may work better for the ACC. Moving average type and length of time will depend greatly on the individual security and how it has reacted in the past.
The dilemma of an investor whether to select exponential moving average or simple moving average can be solved only by obtaining an optimum trade off between sensitivity and reliability. The more sensitive an indicator is the more signals that will be given. Although these signals may prove timely, but they are highly sensitive and may generate false signals. The less
sensitive an indicator is the fewer signals that will be given by it. However, less sensitivity leads to fewer and more reliable signals. Sometimes these signals can be late as well.
Shorter moving averages are very sensitive and generate more signals. The EMA, which is generally more sensitive than the SMA, will also be likely to generate more signals. But along with it numbers of false signals are also high. Longer moving averages will move slower and generate fewer signals. These signals will likely prove more reliable, but they also may come late. Thus it requires every investor to experiment on different moving averages –lengths and their types to examine the trade-off between sensitivity and signal reliability.