Stochastic Oscillator
The Stochastic indicator was developed by George Lane. It compares where a security’s price closes over a selected number of period. The most commonly 14 periods stochastic is used.
The Stochastic indicator is designated by “%K” which is just a mathematical representation of a ratio.
%K= (today’s Close)-(Lowest low over a selected period) (Highest over a selected period)- (Lowest low over a selected period)
For example, if today’s close is 50 and high and low over last 14 days is 40 and 55 respectively then,
%K= 50-40 =0.666
55-40
Finally these values are multiplied by 100 to change decimal value into percentage for better scaling.
This 0.666 signifies that today’s close was at 66.6% level relative to its trading range over last 14 days.
A moving average of %K is then calculated which is designated by %D. The most commonly 3 period’s %D is used.
The stochastic indicator always moves between zero and hundred, hence it is also known as stochastic oscillator. The value of stochastic oscillator near to zero signifies that today’s close is near to lowest price security traded over a selected period and similarly value of stochastic oscillator near to hundred signifies that today’s close is near to highest price security traded over a selected period.
Interpretation of Stochastic Indicator
Most popularly stochastic indicator is used in three ways
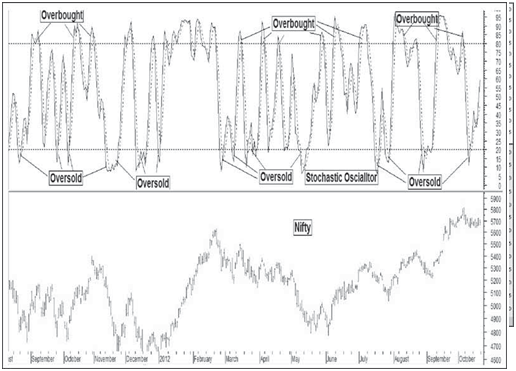
a. To define overbought and oversold zone- Generally stochastic oscillator reading above 80 is considered overbought and stochastic oscillator reading below 20 is considered oversold. It basically suggests that
• One should book profit in buy side positions and should avoid new buy side positions in an overbought zone.
• One should book profit in sell side positions and should avoid new sell side positions in an oversold zone
This would be clearer from figure