Gap theory
A gap is an area on a price chart in which there were no trades. Normally this occurs after the close of the market on one day and the next day’s open. Lot’s of things can cause this, such as an earnings report coming out after the stock market had closed for the day. If the earnings were significantly higher than expected, this could result in the price opening higher than the previous day’s close. If the trading that day continues to trade above that point, a gap will exist in the price chart. Gaps can offer evidence that something important has happened to the fundamentals or the psychology of the crowd that accompanies this market movement.
Gaps appear more frequently on daily charts, where every day is an opportunity to create an opening gap. Gaps can be subdivided into four basic categories:
• Common gap
• Breakaway gap
• Runaway/ Continuation gap
• Exhaustion gap
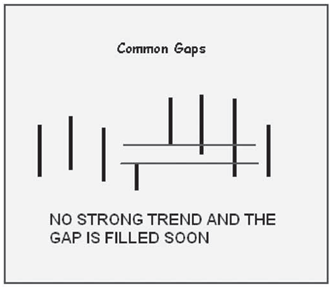
Common gaps
Sometimes referred to as a trading gap or an area gap, the common gap is usually uneventful. This gap occurs characteristically in nervous markets and is generally closed within few days. In fact, they can be caused by a stock going ex-dividend when the trading volume is low. Getting closed means that the price action at a later time (few days to a few weeks) usually retraces to at the least the last day before the gap. This is also known as filling the gap.
A common gap usually appears in a trading range or congestion area and reinforces the apparent lack of interest in the stock at that time. Many times this is further exacerbated by low trading volume. Being aware of these types of gaps is good, but doubtful that they will produce trading opportunities.
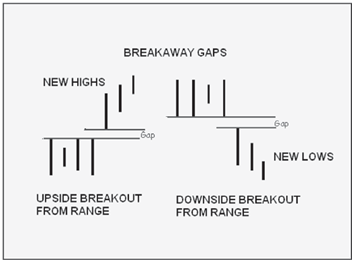
Breakaway gaps
Breakaway gaps are the exciting ones. They occur when the price action is breaking out of their trading range or congestion area. To understand gaps, one has to understand the nature of congestion areas in the market. A congestion area is just a price range in which the market has traded for some period of time, usually a few weeks or so. The area near the top of the congestion area is usually resistance when approached from below. Likewise, the area near the bottom of the congestion area is support when approached from above. To break out of these areas requires market enthusiasm and either many more buyers than sellers for upside breakouts or more sellers than buyers for downside breakouts.
Volume will (should) pick up significantly, for not only the increased enthusiasm, but many are holding positions on the wrong side of the breakout and need to cover or sell them. It is better if the volume does not happen until the gap occurs. This means that the new change in market direction has a chance of continuing. The point of breakout now becomes the new support (if an upside breakout) or resistance (if a downside breakout). Don’t fall into the trap of thinking this type of gap, if associated with good volume, will be filled soon. It might take a long time. Go with the fact that a new trend in the direction of the stock has taken place and trade accordingly.
A good confirmation for trading gaps is if they are associated with classic chart patterns. For example, if an ascending triangle all of a sudden has a breakout gap to the upside, this can be a much better trade than a breakaway gap without a good chart pattern associated with it.
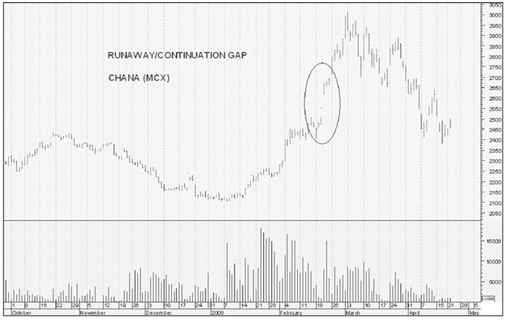
Runaway gaps
Runaway gaps are also called measuring gaps and are best described as gaps that are caused by increased interest in the stock. For runaway gaps to the upside, it usually represents traders who did not get in during the initial move of the up trend and while waiting for a retracement in price, decided it was not going to happen. Increased buying interest happens all of a sudden and the price gaps above the previous day’s close. This type of runaway gap represents an almost panic state in traders. Also, a good uptrend can have runaway gaps caused by significant news events that cause new interest in the stock.
Runaway gaps can also happen in down trends. This usually represents increased liquidation of that stock by traders and buyers who are standing on the sidelines. These can become very serious as those who are holding onto the stock will eventually panic and sell, but sell to whom? The price has to continue to drop and gap down to find buyers. Not a good situation.
The futures market at times will have runaway gaps that are caused by trading limits imposed by the exchanges. Getting caught on the wrong side of the trend when you have these limit moves in futures can be horrifying. The good news is that you can also be on the right side of them. These are not common occurrences in the futures market despite all the wrong information being touted by those who do not understand it and are only repeating something they read from an uninformed reporter.
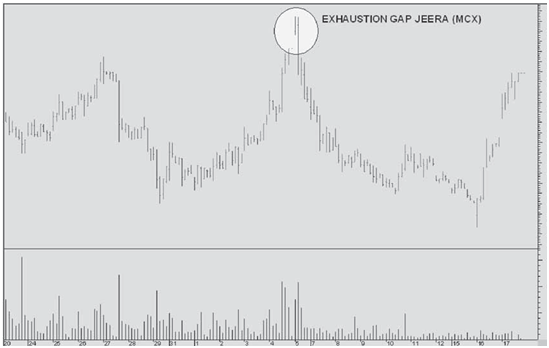
Exhaustion gaps
Exhaustion gaps are those that happen near the end of a good up or down trend. They are many times the first signal of the end of that move. They are identified by high volume and
large price difference between the previous day’s close and the new opening price. They can easily be mistaken for runaway gaps if one does not notice the exceptionally high volume.
It is almost a state of panic if during a long down move pessimism has set in. Selling all positions to liquidate holdings in the market is not uncommon. Exhaustion gaps are quickly filled as prices reverse their trend. Likewise if they happen during a bull move, some bullish euphoria overcomes trades and they cannot get enough of that stock. The prices gap up with huge volume, then there is great profit taking and the demand for the stock totally dries up. Prices drop and a significant change in trend occurs.
Exhaustion gaps are probably the easiest to trade and profit from. In the chart, notice that there was one more day of trading to the upside before the stock plunged. The high volume was the giveaway that this was going to be either an exhaustion gap or a runaway gap. Because of the size of the gap and an almost doubling of volume, an exhaustion gap was in the making here.
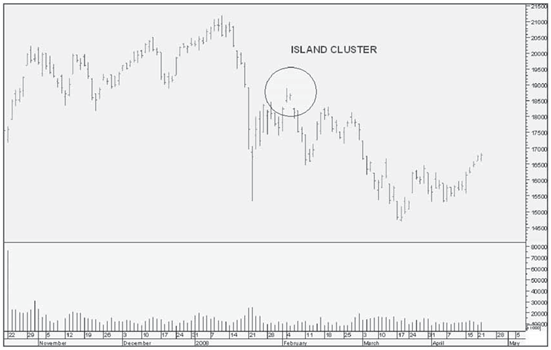
Island cluster
Island clusters are identified by an exhaustion gap followed by a breakaway gap in opposite direction. They are powerful reversal signals
Conclusion
There is an old saying that the market abhors a vacuum and all gaps will eventually be filled. While this may have some merit for common and exhaustion gaps, holding positions waiting for breakout or runaway gaps to be filled can be devastating to your portfolio. Likewise if